Profiling Django
One tool we have when optimizing our code in Django is profiling. Profiling helps us understand where our time is spent, and doing what. It also helps us identify duplication of effort, as well as targets for caching and optimization.
Because our primary goal is to ensure that page loads are as quick as possible for the public, this document focuses on profiling the Django request/response cycle: view code, Wagtail page rendering, etc.
This document covers the tools we use to both generate and understand a profile.
Generating a profile from a URL
To enable profile generation,
we use a middleware that wraps
Python's builtin cprofile module,
django-cprofile-middleware.
This middleware is enabled by default for local development
when DEBUG is True.
For any URL served by Django,
you can add the ?prof querystring
(or &prof to an existing query string)
in order to see a profile of the request/response cycle for that view.
For example, http://localhost:8000/about-us/newsroom/?prof,
might return something like:
         1579654 function calls (1575009 primitive calls) in 28.273 seconds

   Ordered by: internal time
   List reduced from 1108 to 500 due to restriction <500>

   ncalls  tottime  percall  cumtime  percall filename:lineno(function)
    74952    2.349    0.000   17.292    0.000 utils.py:487(__getattr__)
174882/174880    2.036    0.000    4.559    0.000 {built-in method builtins.isinstance}
    58330    1.985    0.000    5.482    0.000 utils.py:328(__getattr__)
    77732    1.900    0.000    5.027    0.000 utils.py:157(__getattr__)
     2776    1.821    0.001   21.265    0.008 documents.py:89(init_prepare)
     …
You can also sort this output using a sort field.
For example, to sort by call count instead of the default time sort: http://localhost:8000/about-us/newsroom/?prof&sort=ncalls.
The can be any supported by
pstats.Stats.sort_stats.
Most usefully, howevever,
you can download the .prof file that contains the profile data,
using a download field.
For example http://localhost:8000/about-us/newsroom/?prof&download.
This will download view.prof, which you can then open in a tool like
SnakeViz
(see below).
Understanding a generated profile
There are a number of tools available
to visualize and understand a .prof profile data file.
The tool we recommend is
SnakeViz,
a browser-based graphical viewer of cProfile data.
To install SnakeViz locally with pipx:
pipx install snakevizAfter downloading the profile data for a Django view, the data can be viewed with SnakeViz with:
snakeviz view.profSnakeViz has two visualization styles, Icicle and Sunburst. Both visualizations represent function calls by the time spent inside the function as a portion of total time of its calling function. The root function will represent the total time for the Django request/response cycle.
For example:
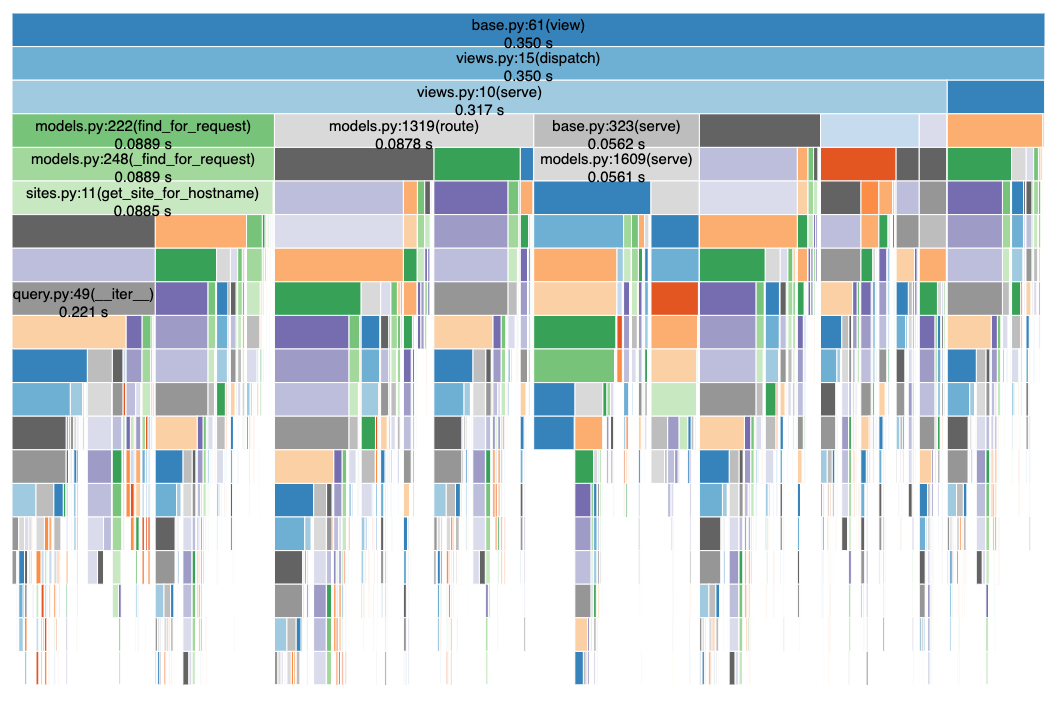
This visualization shows the request/response cycle
took 27.2s in the root view.
We can identify the Wagtail serve() view from models.py.
When hovering over a function in the visualization, you see the function's file, directory, and line number in additional context to the left.
If that function is called multiple times, other calls will also highlight in the visualization. This is a good way to identify duplication that one may wish to refactor.
Basic workflow
Install SnakeViz, if you haven't already:
pipx install snakevizVisit the local URL you wish to profile and download the profile data:
http://localhost:8000/about-us/newsroom/?prof&downloadOpen the profile data in SnakeViz:
snakeviz view.profUse the SnakeViz visualization to identify:
- The call stack of the request/response cycle for a particular Django view
- Bottlenecks in the view's request/response cycle
- Long calls that can be optimized
- Duplicate calls that can be eliminated or cached