Data visualization
Line charts
Use when you have one factor over time to show change. Start your axis at 0 and label your axis to avoid confusion.
Types
Line chart
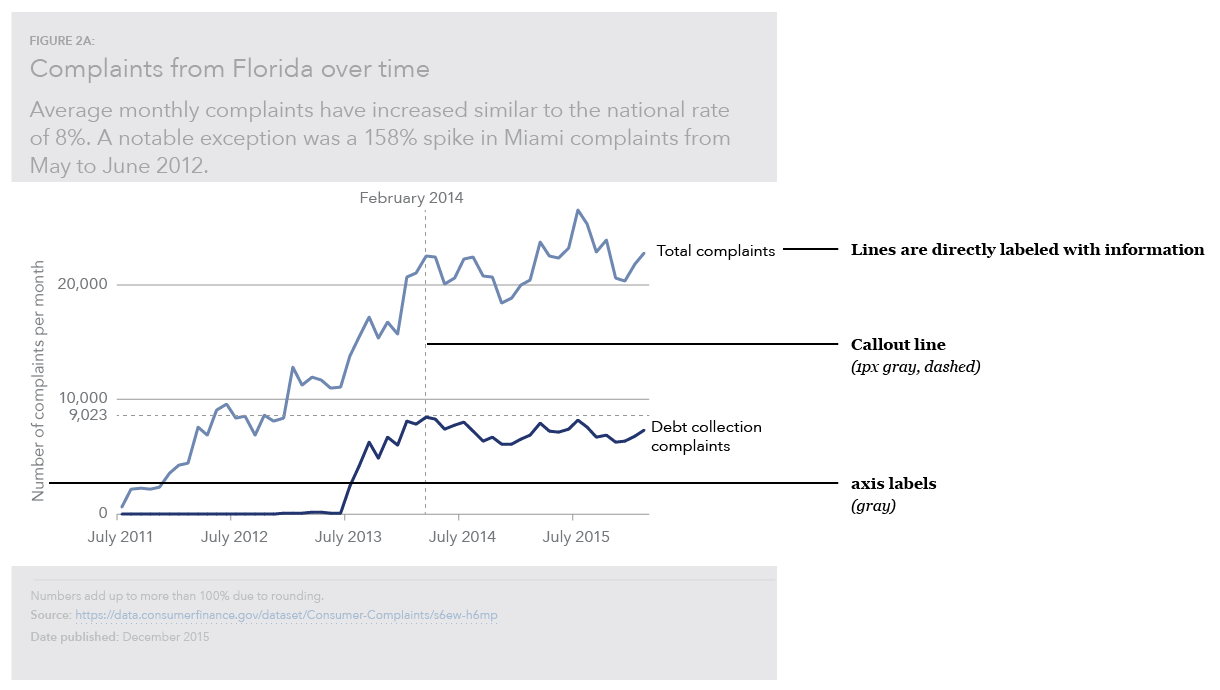
Line chart showing trends
Guidelines
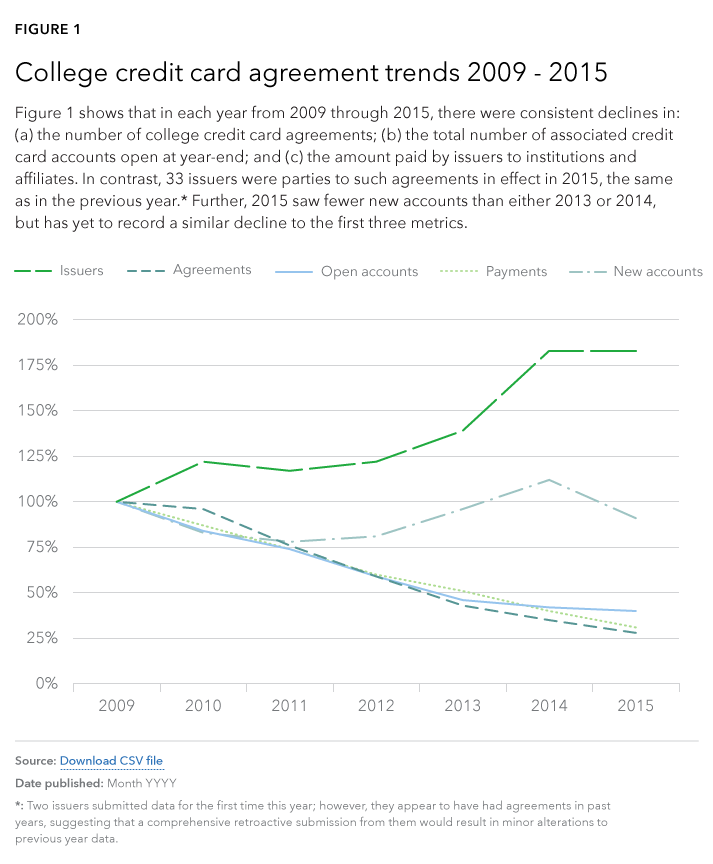
- Label your lines directly or use different patterns for each line.
- Generally show five or fewer lines to avoid confusion.
- Consider using many small line charts if you need to show more factors. (These are called small multiples charts.)
- For color guidance, view Data visualization palettes on the Color page.