Data visualization
Pie charts
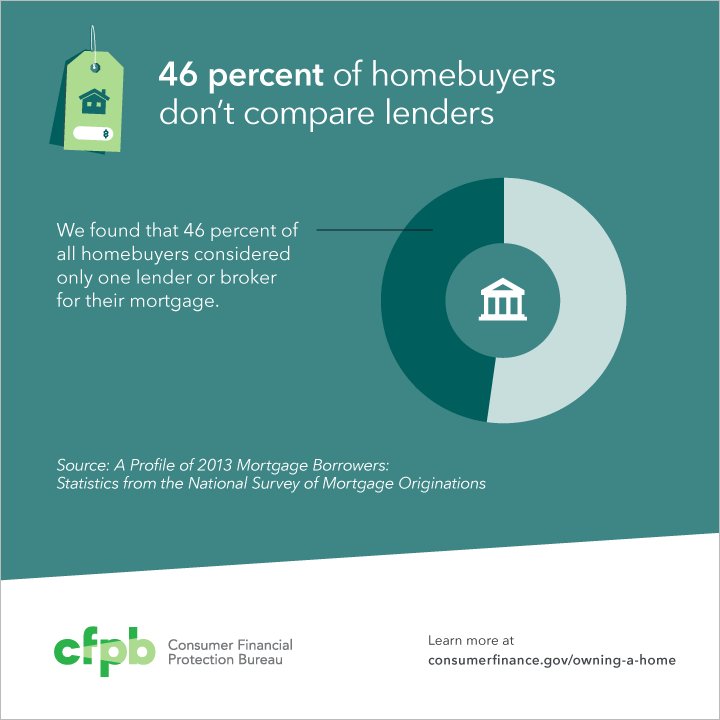
Use when you have less than six things that add up to 100%. Use the middle of the doughnut to highlight the number or category type. You could also consider using a stacked bar chart instead.
Types
Donut chart
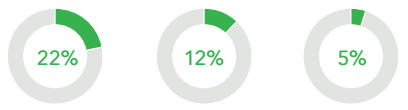
Guidelines
- The slices should add up to 100%.
- Use 5 or less slices.
- Directly label all slices.
- Use a white outline or stroke to create contrast between the slices.
- For color guidance, view Data visualization palettes on the Color page.