Tables
Tables divide information into distinct columns and rows to create an intersection “cell” where data is displayed.
Source Code
-
cf-tables
Tables in Capital Framework
Use cases
Tables are only one method for presenting many data points grouped together in a visual way. Other options include charts or graphs.
Tables serve a unique purpose of allowing easy organization or comparison of more complex data than a chart or graph. They can be read either vertically (by columns) or horizontally (by rows).
Tables work best when:
- Presenting sequential data
- Data being presented requires specific or precise values
- Individual values are being presented or compared
- Values across columns or rows require different units of measurement
| Column 1 | Column 2 | Column 3 |
|---|---|---|
| Cell A1 | Cell A2 | Cell A3 |
| Cell B1 | Cell B2 | Cell B3 |
| Cell C1 | Cell C2 | Cell C3 |
| Cell D1 | Cell D2 | Cell D3 |
Stacking tables
Since the nature of tables relies so much on visual space, there are several common variations that can be used to accommodate different types of data in a table.
A default table would “stack” the information on a smaller screen, since shrinking a table that maintained its columns/row structure would make it illegible.
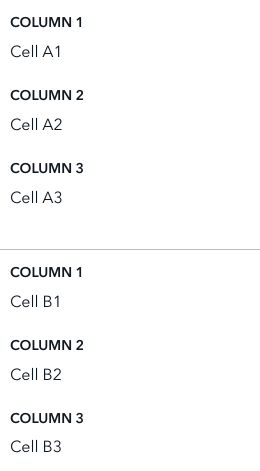
Directory tables
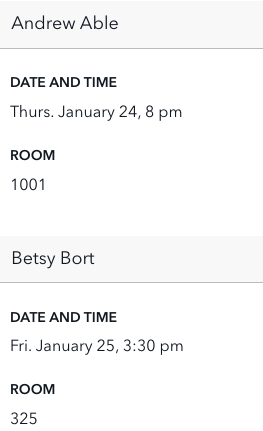
When the data you’re presenting should only be read across the rows (instead of down columns), you can use a directory table. The first column in these tables is what organizes or labels the other data points in the row.
For instance, contact information is comprised of a name, phone number, and email address. An event is made up of the name of the event, time, and location. You need all three pieces of data to create an understanding of the thing being shown, and the first column of data is the key to that understanding.
The default stacking behavior on smaller breakpoints doesn’t maintain that “first column” importance since it stacks based on column headers.
As such, at the small screen breakpoint, the directory table pattern uses that first column data (employee name, for instance) as a way to group and label stacks of rows.
See guidance on styles for a a directory table and how it should look on smaller breakpoints.
Table 1: Directory table on large screens
| Employee | Date and time | Room |
|---|---|---|
| Andrew Able | Thurs. January 25, 8 pm | 1001 |
| Betsy Bort | Fri. January 25, 3:30 pm | 325 |
| David Jones | Fri. January 25, 3 pm | 1001 |
| Sarah Lamb | Mon. January 28, 8 pm | 801 |
Table 2: Directory table on small screens
Scrolling tables
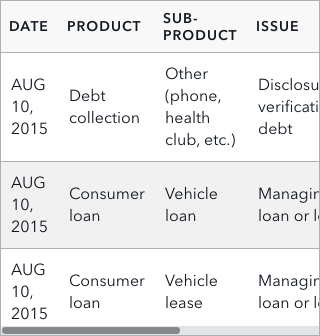
When the data you’re presenting has more columns than what will comfortably fit on the screen, you can use a table that scrolls horizontally. This becomes especially important when thinking about tables on smaller screens, instead of allowing the data to stack at smaller breakpoints.
Using a table that scrolls ensures that all the information can be accessed in its original tabular structure, even on a smaller screen.
See guidance on styles for a table that scrolls horizontally at all screen sizes.
Behavior
Sorting tables
Sorting allows users to reorder the contents of a table by a sortable column of their choice.
Any column that can sort needs to be specified in the table’s markup. When the table loads, it should be sorted by one of the sortable columns by default and indicate which column is already sorted. Not every column of a table needs to be sortable.
At large screen sizes, tables can be sorted using the header of any sortable column.
- The currently sorted column is marked with an up or down triangle for ascending and descending sorts, respectively
- On hover, the currently sorted column shows the opposite triangle
- Columns that can sort show an up triangle on hover
- Columns that cannot sort show nothing on hover
If sorting is needed for smaller screens, use a filter-like expandable with a sorting control (or add a sorting control to the existing filter if the table has one) that only appears when the table switches from tabular to stacked.
| Agency | ||
|---|---|---|
| Alpha | English | 2.6 mi |
| Beta | English, Spanish | 1.4 mi |
| Gamma | English, French, Spanish | 1.4 mi |
| Delta | English, Spanish | 3.2 mi |
Filtering tables
Tables can be paired with a filter to show only rows that meet certain criteria.
| Type | Title | Date |
|---|---|---|
| Blog | Three things to do before closing | AUG 5, 2015 |
| News | Electronic Mortgage Closings Can Benefit Consumers | AUG 5, 2015 |
| Blog | National Day of Civic Hacking 2015 | JUL 29, 2015 |
Pagination
Tables with over 20 rows can be paired with pagination.
| Type | Title | Date |
|---|---|---|
| Blog | Three things to do before closing | AUG 5, 2015 |
| (18 more rows) | ||
| Blog | National Day of Civic Hacking 2015 | JUL 29, 2015 |
Creating accessible behaviors
Remember to always use headers (that is, <th> elements) for all data tables to make tabular data accessible.
Content guidelines
As a rule, design tables so that they are easy to read. Label columns precisely and include units of measurement where necessary. Organize the data so that the underlying meaning is quickly apparent.
Labels and titles
Give tables a meaningful title that succinctly describes the content presented so that users can understand their purpose at a glance. If presenting more than one table within a page, consider adding labels (e.g. “Table 1,” “Table 2,” etc.) in addition to titles. Labels should precede titles (e.g. “Table 1: The title given to this table”).
Styles for labels and titles are found here.
Long column labels
Consider using fixed columns or truncation for column labels that are significantly longer than the expected width of the data.
Units of measurement
Make sure to indicate the unit of measurement. In terms of placement, if the units are the same across columns, indicate the unit of measurement in the title or someplace noticeable above the table.
Alternatively, if the table uses at most two units of measurement, consider using asterisks following the column label, and define the unit of measurement below the table, as shown in the example here.
If units differ from column to column, the standard is to list the unit of measure in parentheses following the column label. Make sure to use common abbreviations when indicating units of measure. Spell out any ambiguous or obscure abbreviations.
Table 1: Budget by strategic goal
| FY 2011* | % | FY 2012* | |
|---|---|---|---|
| Goal 1 | $252.0 | 48% | $279.4 |
| Goal 2 | $107.8 | 20% | $131.6 |
| Goal 3 | $46.4 | 9% | $56.3 |
| Goal 4 | $118.2 | 23% | $138.6 |
| Total | $524.4 | 100% | $605.9 |
* In millions
Table 2: Key investments
| Outcome | Key investment descripton | % |
|---|---|---|
| 1.1 | Disclosure, design, testing, implementation | 16 |
| 1.2 | Small business rulemaking | 9 |
| 1.3 | Large business rulemaking | 20 |
* In millions
Style View code
Default table and directory table (large screens)
This is the default style at the large screen breakpoint. It is also how the directory table pattern appears at the large screen breakpoint.
Header
- Background: Gray-05 #F8F8F8
- Font: Avenir Next Demi-bold, all caps
- Font-color: Black #101820
- Font-size: 14px
Border
- Bottom: 1px, Gray-50 #BABBBD on each row, including header
Cells
- Background: Gray-05 #F8F8F8
- Font: Avenir Next Regular Black
- Font-color: Black #101820
- Font-size: 16px
- Padding: 10px
| Column 1 | Column 2 | Column 3 |
|---|---|---|
| Cell A1 | Cell A2 | Cell A3 |
| Cell B1 | Cell B2 | Cell B3 |
| Cell C1 | Cell C2 | Cell C3 |
| Cell D1 | Cell D2 | Cell D3 |
Default table (small screens)
This is the default style for small screens. Remember to add data-label attributes to every <td> in the table body.
Border
- Bottom: 1px, Gray-50 #BABBBD
Cells
- Font: 16px Avenir Next Regular Black
- Font-color: Black #101820
- Labels font: 14px Avenir Next Regular, all caps
- Labels font-color: Black #101820
Padding
- Padding, label / content: 15px
- Padding, content / next label: 30px
- Padding, rule line / first label: 15px
Scrolling tables
- Border: 1px, Gray-50 #BABBBD around the scrolling table
- Alternate row striping: Grey-05 #F8F8F8
Directory tables (small screens)
- Bottom border: 1px, Gray-50 #BABBBD on each row
- Font: 16px Avenir Next Regular Black
- Font-color: Black #101820
- Header background color: #f1f1f1
- Labels font: 14px Avenir Next Regular, all caps
- Labels font-color: Black #101820
- Padding, column label/bottom border: 15px
- Padding, bottom border/content: 15px
- Padding, content / next label: 30px
Striped rows
Striping is useful to help the eye track across table rows. Use striping for tables that have more than five columns, or for tables with rows that are difficult to follow across the full width of the table.
- Alternate row background: Grey-05 #F8F8F8
| Column 1 | Column 2 | Column 3 |
|---|---|---|
| Cell A1 | Cell A2 | Cell A3 |
| Cell B1 | Cell B2 | Cell B3 |
| Cell C1 | Cell C2 | Cell C3 |
| Cell D1 | Cell D2 | Cell D3 |
Alignment
Right-align columns of numbers that contain quantities (counts, dollar amounts, percentages) or ordinals (ranks, item numbers).
Left-align columns of nominal numbers (ZIP codes, room numbers) or non-numeric values (names, phrases).
| County | ZIP | Records |
|---|---|---|
| Abbeville | 96122 | 8 |
| Abbey | 94012 | 586 |
| Acadia | 96201 | 126 |
| Acer | 96104 | 1,685 |
Fixed-width columns
Column widths are automatically set by browsers by default. If needed, some or all columns can be set to specific widths instead to accommodate longer data or labels.
Fixed-width columns at the 600 px breakpoint and less lose their custom widths and expand to full width. This is the same responsive pattern used for default tables at small screens.
Table 1: Table with column widths set automatically by the browser
| County | Lien status | Active? |
|---|---|---|
| Abbeville | Secured | Yes |
| Abbey | Secured | No |
Table 2: Table with columns fixed at 20%, 60%, and 20% of the table width
| County | Lien status | Active? |
|---|---|---|
| Abbeville | Secured | Yes |
| Abbey | Secured | No |
Table labels and titles
- Label font: 14pt Avenir Next Demi Bold
- Label font-color: Black #101820
- Title font: 16px Avenir Next Regular
- Title font-color: Black #101820
Table 1: Budget by strategic goal
| FY 2011* | % | FY 2012* | |
|---|---|---|---|
| Goal 1 | $252.0 | 48% | $279.4 |
| Goal 2 | $107.8 | 20% | $131.6 |
| Goal 3 | $46.4 | 9% | $56.3 |
| Goal 4 | $118.2 | 23% | $138.6 |
| Total | $524.4 | 100% | $605.9 |
* In millions